Circuit Breaking Using Istio
Circuit breaking is an important pattern for creating resilient microservice applications. Circuit breaking allows you to write applications that limit the impact of failures, latency spikes, and other undesirable effects of network peculiarities.
circuit breaking in Istio is handled by DestinationRule.
How Does Circuit Breaker Work?
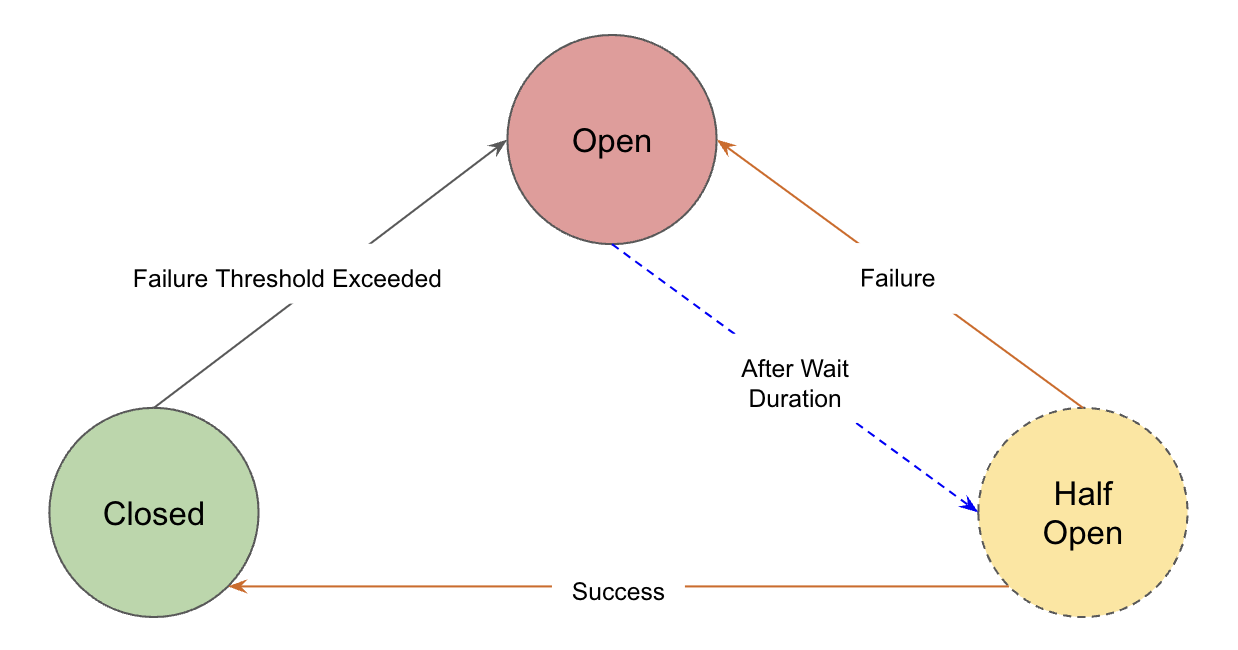
A circuit breaker typically operates in three main states: Closed, Open, and Half-Open.
-
Closed
Normal operation, requests pass through, system monitors for issues.
If requests are successful, it remains in the
Closedstate. However, if the Failure Threshold is exceeded, it transitions to theOpenstate. -
Open
Detected issue, blocks all incoming requests immediately.
Once in the
Openstate, the circuit breaker undergoes a reset after a pre-defined delay. Following the reset, it transitions to theHalf-Openstate. -
Half-Open
Testing phase, allows limited requests to check if the issue is resolved before deciding to fully reopen or stay closed.
If the request is successful, it transitions to the
Closedstate; if unsuccessful, it transitions back to theOpenstate.
Let's see it in action!
Step 1: Deploy Application
First, let's deploy the application and other Istio components:
Make sure to replace the value of external-dns.alpha.kubernetes.io/target annotation in virtual service with the istio load balancer DNS.
Note
The reyanshkharga/nodeapp:buggy application intermittently throws an intentional error with HTTP status code 502.
Assuming your folder structure looks like the one below:
|-- manifests
│   |-- 00-namespace.yml
│   |-- nodeapp-deployment.yml
│   |-- nodeapp-service.yml
│   |-- gateway.yml
│   |-- destination-rule.yml
│   |-- virtual-service.yml
Let's apply the manifests to create the kubernetes and istio objects:
Verify if the istio proxies are created for the application:
# Retrieve proxy configuration
istioctl proxy-config routes svc/istio-ingressgateway -n istio-system
Step 2: Generate Traffic Using Fortio
Fortio is a fast, small (4Mb docker image, minimal dependencies), reusable, embeddable go library as well as a command line tool and server process, the server includes a simple web UI and REST API to trigger run and see graphical representation of the results (both a single latency graph and a multiple results comparative min, max, avg, qps and percentiles graphs).
Deploy a fortio pod as follows:
Now, let's generate traffic on our nodeapp service using fortio as follows:
# Set fortio pod name
export FORTIO_POD=traffic-generator

# Call nodeapp service using fortio pod (Try this multiple times)
kubectl exec $FORTIO_POD -n circuit-breaker -c fortio -- /usr/bin/fortio curl -quiet http://nodeapp-service
You'll notice that as soon as the application throws a 5xx error (502 in this case), the circuit breaker outlier detector ejects the pod from the load balancing pool for specified baseEjectionTime and in that time period all the requests fail. This is circuit breaking in action.
Wait for baseEjectionTime and try again.
Step 3: View Prometheus Metrics
You can see the UO (upstream overflow) metric in prometheus using the following query:
sum(istio_requests_total{destination_app="nodeapp", source_app="traffic-generator"}) by (response_code, response_flags, source_app)
U0 flag indicates that requests were rejected due to circuit breaker configuration.
Clean Up
Assuming your folder structure looks like the one below:
|-- manifests
│   |-- 00-namespace.yml
│   |-- nodeapp-deployment.yml
│   |-- nodeapp-service.yml
│   |-- gateway.yml
│   |-- destination-rule.yml
│   |-- virtual-service.yml
│   |-- fortio-traffic-generator.yml
Let's delete all the kubernetes and istio resources we created: